Tables Part 3_在列表中使用公式(二)_Excel 2007新知
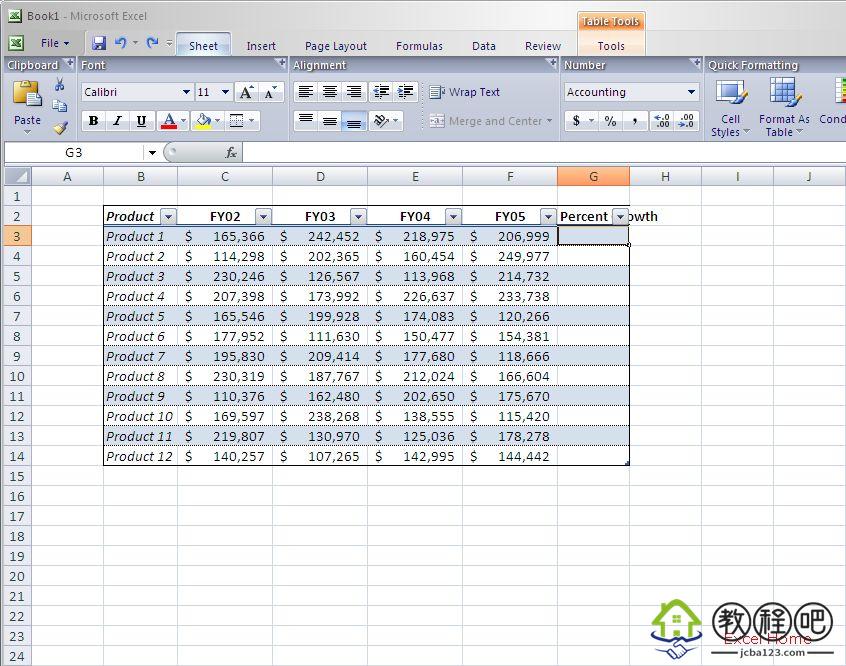
When I press enter to commit the
change, Excel adds another column to my table – the appropriate
formatting is applied to the rows, the border around the table adjusts,
etc. So far so good.
按下回车键之后,Excel为我的列表添加新的一列——相应的格式将会应用到所有的新添加的行,列表的边框也将进行相应当调整。
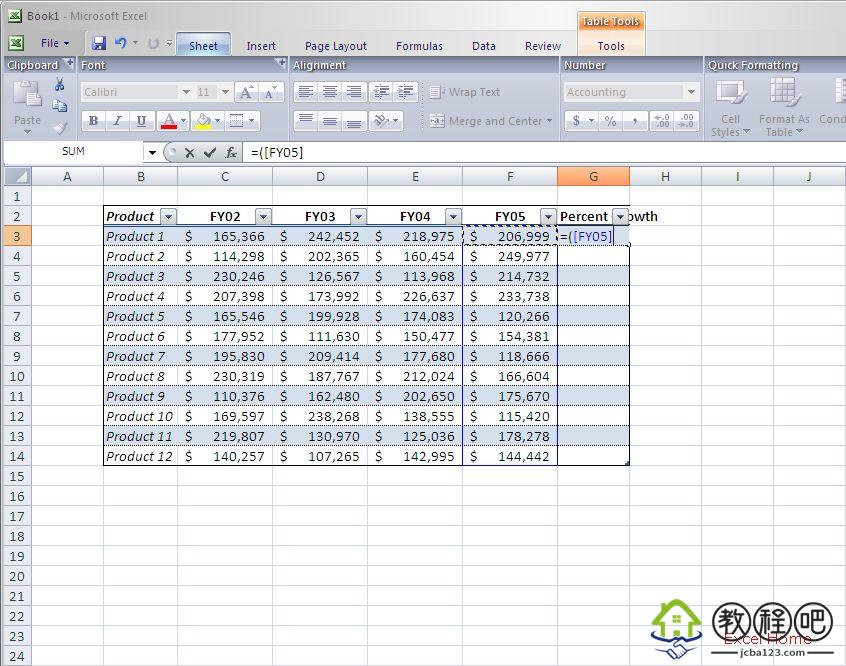
The next step is to write the formula. I
might do something like type “=(” and then use the keyboard to move
selection over to the cell I want to calculate – in this case FY05.
Excel gives me the following reference: [FY05].
下一步是输入公式,输入“=(”之后,然后用键盘选中需要计算的区域——也就是本例子中的FY05,Excel将自动输入[FY05]。
As you can see, when referencing a
table from within the table itself it is not necessary to prefix the
table name. As I use other columns in my formula, they get similar
references.
这里我们可以看到,如果在列表中使用本列表的相关引用名称,那么不需要列表名称作为前缀,使用类似的方法可以在公式中引用其他的列。
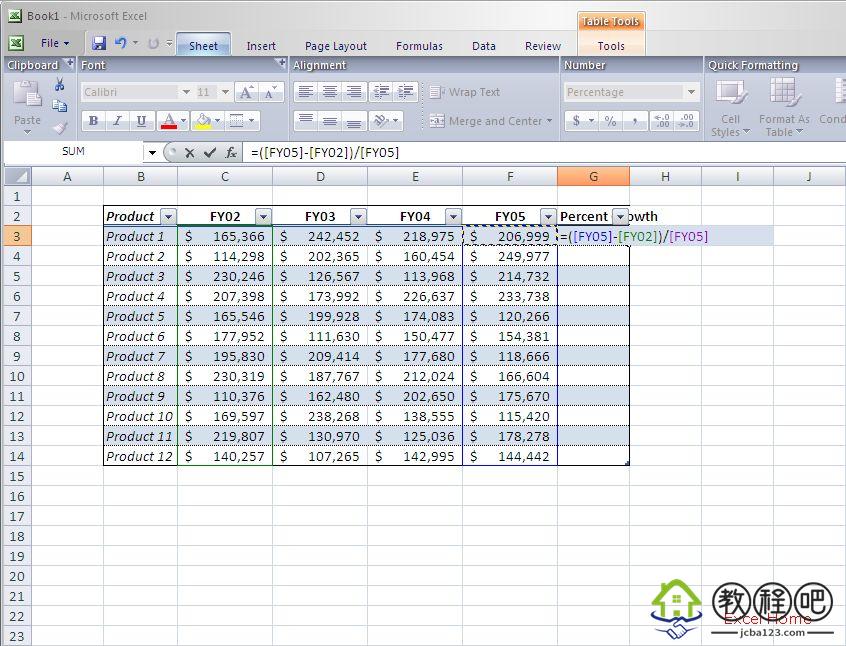
When I am finished with my formula and
press ENTER, Excel automatically fills that formula down for all rows in
the Percent Growth column.
当我输入完公式并按回车后,Excel将自动在“Percent Growth”列中向下填充公式。
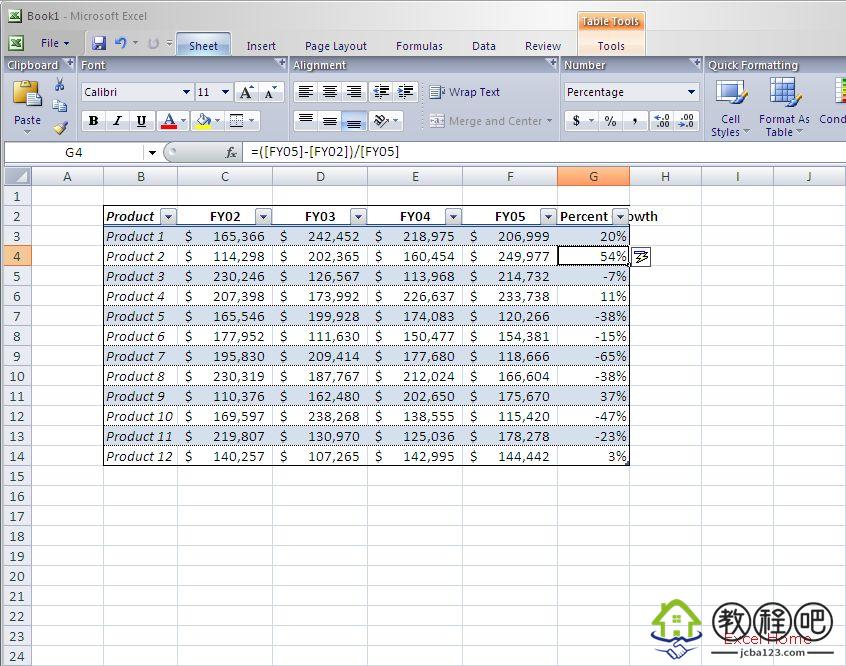
This is another new feature of tables
called calculated columns. Any time a formula is entered into an empty
table column it will automatically fill. We think this will help reduce
errors introduced by manual filling or copy/paste. Not only does it
fill, but it continues to fill down as you add or delete rows in the
table. This is another one of those “sticky” properties I mentioned in
my previous post. As with other table features, the user does have
control over its behavior – at the time you enter a formula in a cell in
a calculated column, the auto-fill can be undone using on-object UI
(which you can see in the previous screen shot). Further, if you really
do not want columns filling down ever, the feature itself can be turned
off.
这是另一个新的数据表功能称为计算列(译者注:“计算列”是“calculated
columns”的直译,其含义为如果列表中的某个数据列包含计算公式则被称为“计算列”),任何时候只要在空白的表格列中输入公式,公式都会自动填充,我们认为这个功能会减少手动填充和复制/粘贴带来的错误,填充功能并不仅限于当前列表,用户在列表中添加或者删除列时,公式填充也会进行相应当调整,这也是我在上个帖子中提到“附着”功能的另一个例子,实际上,用户可以完全掌控这些功能——在计算列的某个单元格中输入公式时,利用系统的提示标志(译者注:英文名称为“on-object
UI ”,即上图中位于H4单元格的提示标志)可以取消自动填充公式(在上图中可以看到),当然用户也可以通过系统设置关闭这项功能。
If the calculated column ever needs to
be updated, it is only necessary to edit one copy of the formula and the
change will propagate to all rows. In addition, it is possible to
change any single row (e.g. enter a static value or custom formula) so
that it is not consistent with the calculated column. Such cells will be
flagged visually so that inconsistencies will be easy to spot. For
example, if I enter =RAND() in the middle of my column and choose not to
fill down, I see a green triangle in the upper left-hand corner of the
cell.
如果计算列需要更新公式,只需要修改其中的一个公式,计算列中的其他公式会相应当更新,另外,单独更改计算列中的某行数据(例如输入静态数值或者自定义公式)也是可以的,这样会使这部分单元格不再与计算列保持同步,为了容易识别这类单元格(译者注:下文中称此类单元格为“另类单元格”),系统会为它们设置一个标记,例如我在某列的单元格输入=RAND(),并选择取消自动填充公式,这个单元格的左上角将出现一个绿色的三角标志。
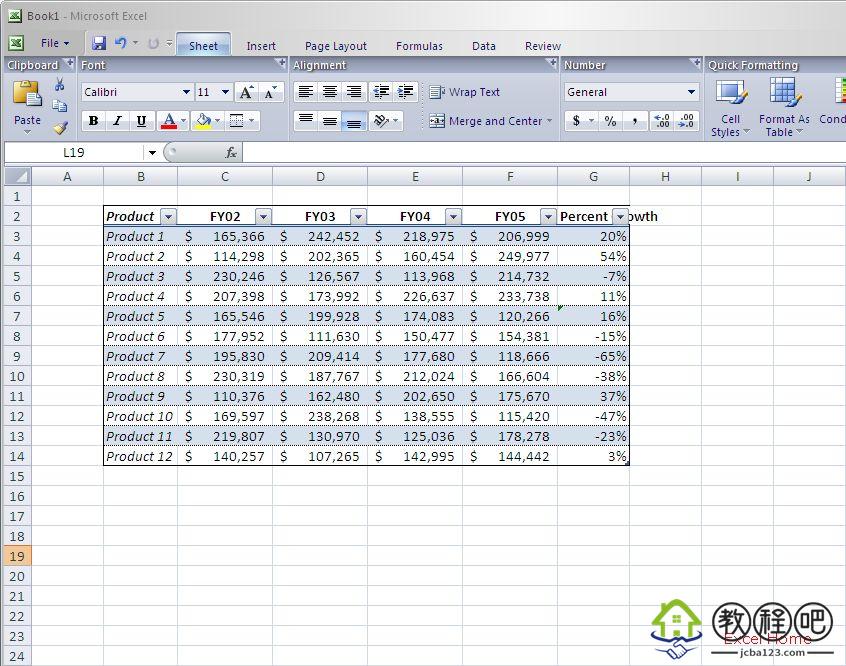
Furthermore, once a calculated column
contains inconsistencies, subsequent edits to cells in the calculated
column do not propagate because Excel does not want to overwrite custom
values. However, the same UI shown above will appear allowing the user
to opt-in to the behavior.
请注意,一旦计算列中包含了另类单元格,为了避免覆盖自定义数据或者公式,对于计算列单元格的所有后续操作都不再扩展到整列,但是上面提到的提示标志仍然会出现。
The last feature I want to talk about
is the table totals row. (For those that use Excel 2003 Lists, you will
recognize the totals row, but we have made some nifty improvements since
2003, so please read on.) The totals row is another special area of the
table, like the header row. It lives at the bottom of the table and its
purpose is to calculate totals for the columns in a table.
现在介绍一下列表的最后一个功能汇总列(Excel
2003用户可能会认为已经知道这个功能了,然而在2003基础之上我们做了很多非常好的改进,请大家继续阅读本文),像标题行一样,汇总行是列表中的另一个特殊区域,它位于列表的最下部,用于计算列表中每列数据的总和。
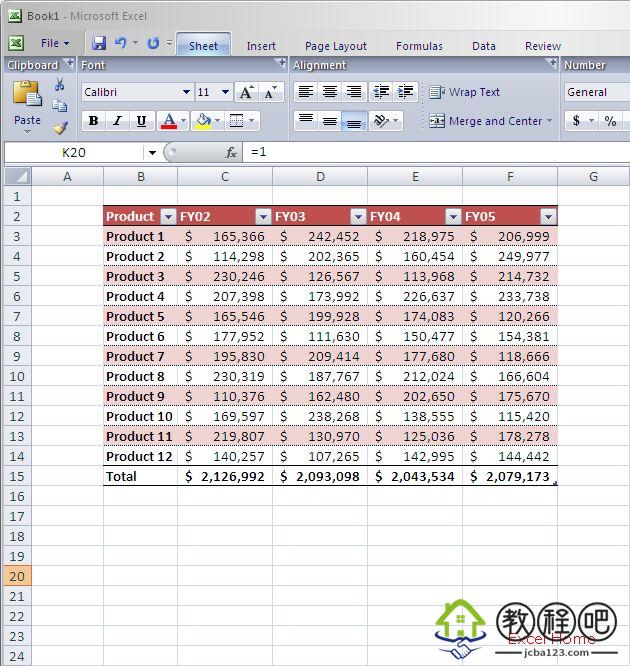
The total row can be enabled via the
table tab in the ribbon, right-click on the table, or by using the
existing AutoSum functionality. The nice thing about having a special
area for totals in the table is that it participates in the table’s
activities. It grows and shrinks properly with the table, it gets
special “total row” formatting when you apply a style to the table (more
on table styles in a later post), and the formatting behaves
appropriately as more columns are added to the table.
用户如果需要使用汇总行功能,可以通过下面的几种方法:点击Ribbon上的列表标签、在列表上点击鼠标右键或者使用传统的自动求和功能,列表中保留这个特殊区域的好处在于,当列表扩展或者收缩时,汇总行会相应地更新,另外,用户设置的列表风格同样对于“汇总行”有效(关于列表风格的更多内容请参考随后的帖子),其格式的处理方法类似于表格中增加新的列。
The total row cells can contain pretty
much any kind of formula (the formulas don’t have to reference the table
at all but we don’t expect that to be the common case) as well as text
labels. The cells in the totals row also contain a dropdown that shows
you some of the most commonly used functions, lowering the bar for the
new Excel user to write formulas.
汇总行可以使用各种公式(公式甚至可以引用列表区域之外的数据,但是我们不推荐这种用法)和文本标签,汇总行中的单元格具备下拉按钮,可以为用户提示一些常用的功能,当然用户也可以使用最下面的工具条输入公式。
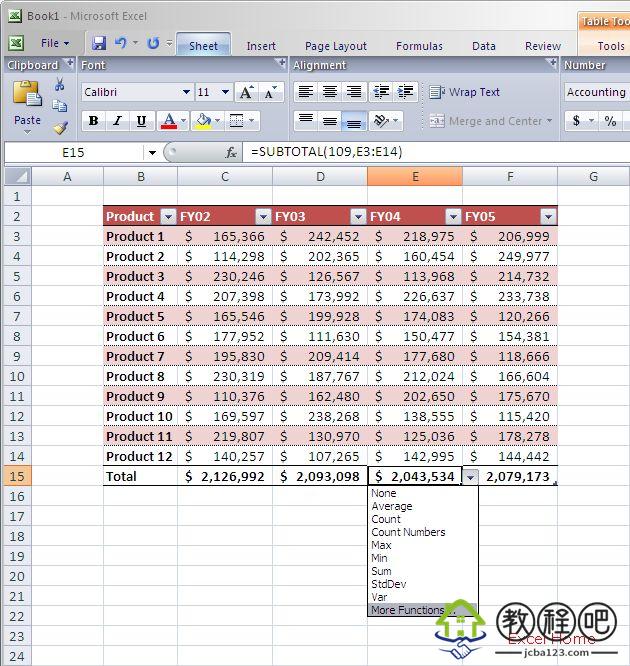
The total row can be toggled on and
off, and any functions that exist in the total row will be “remembered”
until the next time you turn it back on.
用户可以很容易的选择是否使用汇总行,Excel能够“记住”汇总行中已有的设置,在用户下次激活汇总行功能时这些设置可以自动回复。
So now let’s finish our discussion of
syntax, since some of you are probably asking questions like “how do I
reference the entire table, headers and all?” Referencing the entire
table can be done this way: =Table1[#All]. Or if you just want to
reference the headers: =Table1[#Headers]. To reference the entire
column: =Table1[[#All], [Column1]]. To reference just the header value
of a column: =Table1[[#Headers], [Column1]]. The special keywords can
also be combined: =Table1[[#Headers],[#Data],[Column1]]. At this point I
think you get the idea.
现在我结束关于语法的讨论,因为某些用户可能会问到下面的问题“我如何引用全部数据、标题和整个列表?”其实很简单,使用=Table1[#All]就可以引用这个列表,如果你只需要引用标题行可以用=Table1[#Headers],引用列表中的某列数据用=Table1[[#All],
[Column1]],如果只是引用某列第标题的内容则用=Table1[[#Headers],
[Column1]],这些关键字可以组合使用如=Table1[[#Headers],[#Data],[Column1]],到现在为止我想你已经知道如何引用列表的相关部分。
Some other points about structured
references: table names are globally unique to a workbook and do not
require a sheet reference like Sheet1!Table1. Table column names must be
unique within the table itself. Table names co-exist in the same
namespace as named ranges, meaning you can’t have a defined name with
the same name as a table, and vice-versa. If the table name or any of
the column names change then any formulas that reference those names
will automatically update as well. Structured references can be created
using selection with the mouse (and yes, there is an option to turn this
off). In fact, structured selection (I talked about it in my last post)
is one way to very quickly generate structured references when writing
formulas.
关于结果引用还有几点要说明:列表的名称在某个工作簿中是唯一的,所以引用列表时不需要类似
Sheet1!Table1的显式声明其所在地工作表,在某个列表中列名称也必须是唯一的,列表名称和区域名称是共同存在的,也就是说不能将某个已经存在的列表名称定义区域的名称,反之亦然。如果改变列表名称或者任何列的名称,那么包含这个引用的所以公式将同时自动更新,结构化选中可以使用鼠标(当然可以关闭这项功能),实际上结构化选中(请参考我的上一个帖子
Tables Part2:附着,结构化选中…)是在公式中输入结构化引用的快捷方法。
That’s it for now. For my next post I will delve into the work we’ve done around the area of autofilter. Multi-select anyone?
今天就到这里,我的下一个帖子将研究自动筛选或者多选。
Published Friday, October 28, 2005 10:25 PM by David Gainer